
In our article exploring safeguards in AI, we considered the benefits of AI generated decisions being “locally explainable”. This worked example shows how this would operate in practice.
The image below shows an extract of an example of what a locally explainable system would generate in respect of an individual candidate. The algorithm will have taken data from a CV or other input data or will have taken data from an assessment (or both) and identified the factors or features which correlate best to success and the appropriate weighting to be given to each.
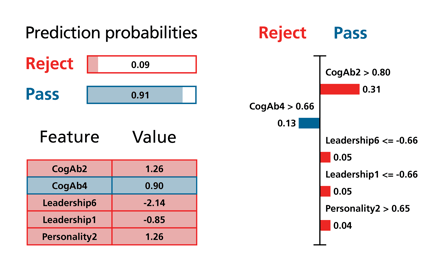
In the above example, the algorithm has determined that various features contribute to predicting the success of a candidate for a post. These have been categorised and given a label - shorthand for a more readily understandable feature (e.g “Leadership 1” might, for example, be a label used for years of management experience).
The above extract includes five of the features used by this algorithm (such as CogAb 2 (cognitive ability 2) etc.). Each feature is weighted, and this is represented by the size of the bar in column two (i.e. , CogAb2 counts for 31% of the total score). In reality, there would be many more features used by the algorithm but these five represent the most significant features with the highest weighting, accounting for 58% of the total score.
Each feature also has a “par” threshold score. In the above example, the score for this individual for four of the features is above the threshold (orange). However, for this individual their score for CogAb4 is below the threshold (blue).
This individual’s total score is set out in the first column and the 0.91 pass figure could be equated to a 91% score and could be used as a comparator against other candidates’ score.
For a given individual it is possible to run counterfactuals where data about an individual is changed and any difference in the outcome can be seen. For example, if a candidate considered that a career break in their CV had counted against them, this piece of data could be changed, and the outcome observed.
With local explainability, the basis on which a decision has been made can be explained accurately and in precise detail. For example, an unsuccessful candidate can be told that they scored below par for years of management experience and that with two more years of experience their candidacy would have been successful. Such accuracy and precision are not available with most human made decisions.
System developers apparently express concerns that local explainability could lead to the gaming of a system. However, this concern is overblown as algorithms are continually changing through machine learning particularly if deployed using “single tenant” infrastructure separate from similar systems used by other deployers.
Assessing disparate impact
An outcome with local explainability is that each material feature or factor can be assessed transparently for disparate impact. The table below represents an extract of one outcome where each columns represents a factor taken into account in achieving the outcome (in this case the full table shows over 50 columns/factors and over 8,000 candidates). Assuming that the numbers are statistically significant (and the numbers considered can be in the thousands), it is possible to consider the impact of each factor by gender, ethnicity etc.
| Candidate Id | Pass | Gender | Ethnicity | CogAb1 | CogAb2 | CogAb3 | CogAb4 | CogAb5 | CogAb6 |
| 0 | 1 | Female | Black | -0.17883 | 0.147077 | 0.775331 | -0.42789 | 0.640818 | -0.61043 |
| 1 | 1 | Male | Hispanic | 0.092276 | 0.122023 | 0.482935 | -0.23213 | -1.93906 | -1.14022 |
| 2 | 0 | Female | Hispanic | -1.70338 | -0.96215 | -0.7855 | -0.6339 | -0.33472 | -1.55596 |
| 4 | 1 | Male | Hispanic | -0.36301 | 1.264307 | 1.667603 | 0.903941 | 0.06284 | 0.680886 |
| 5 | 0 | Male | Black | 0.152488 | -0.73182 | -0.16713 | -1.1934 | 1.180502 | 0.469656 |
| 6 | 0 | Female | Black | 0.055918 | -0.29116 | -0.78782 | -0.77731 | 1.304448 | 0.522195 |
| 7 | 0 | Male | Black | 0.698395 | -0.31258 | 0.150934 | 1.706846 | 0.080574 | 0.127306 |
| 8 | 0 | Male | Black | -0.52555 | 1.77403 | -0.62513 | 0.665376 | 0.217817 | 0.432447 |
| 9 | 1 | Male | Hispanic | -0.68294 | 1.067975 | 1.309224 | -0.61885 | 2.029577 | -0.68297 |
| 11 | 0 | Male | White | 0.200835 | -0.83257 | 0.749262 | 1.174583 | 0.75329 | -0.60081 |
| 12 | 0 | Female | Asian | -2.61771 | -1.1744 | -1.53815 | 0.651628 | 0.273063 | 1.317664 |
| 13 | 1 | Female | Hispanic | -0.90534 | -0.94525 | 0.34392 | -0.95104 | -0.36853 | -0.76791 |
| 14 | 0 | Female | Black | 0.469724 | -0.21459 | 0.041266 | -0.29194 | 1.236188 | 0.105533 |
| 15 | 0 | Female | Hispanic | 0.422711 | -1.41777 | 0.190129 | -0.28289 | 0.005246 | 0.40411 |
| 16 | 0 | Male | Black | -1.61116 | -0.45333 | -1.18543 | 1.076583 | 2.092224 | 0.333299 |
| 17 | 0 | Female | Hispanic | -2.29134 | -0.74864 | 1.233434 | 1.118989 | 2.446111 | 0.056212 |
| 18 | 0 | Male | Hispanic | 0.254214 | 0.420534 | 0.036643 | 0.342098 | 0.448201 | 0.416946 |
| 20 | 0 | Female | Hispanic | -0.26307 | 0.882736 | 0.149795 | 1.236129 | -1.78728 | -1.39379 |
| 21 | 0 | Female | Asian | 0.511523 | 0.11612 | -0.2004 | 2.384029 | 1.136298 | -0.1979 |
Where such is impact is identified, human intervention can assess whether this disparate impact is objectively justifiable and lawful. Of course, gender and ethnicity are not amongst the source data or data inputted in respect of the candidates considered by the algorithm. In this case, this information is only supplied for the disparate impact analysis.
